
Markets are supposed to be rational. Prices reflect information, participants weigh data, and outcomes follow logic. At least, that’s the theory. In practice, a surprising number of investors, seasoned professionals included, quietly scan the calendar, watch certain chart patterns, or nervously follow football results before making decisions. The human brain craves pattern, even where none reliably exists.
What follows are nine coincidences, indicators, and eerie parallels that have accumulated enough of a track record, or enough psychological weight, to keep showing up in trading rooms and financial conversations decades after they were first observed. Some carry a grain of genuine predictive value. Others are pure folklore. All of them still trigger fear.
1. The Inverted Yield Curve
1. The Inverted Yield Curve (Image Credits: Unsplash)
Few signals in modern finance carry as much dread as an inverted yield curve. The rule of thumb is that an inverted yield curve, meaning short-term rates above long-term rates, indicates a recession in about a year, and yield curve inversions have preceded each of the last eight recessions as defined by the NBER. That kind of consistency makes it hard to dismiss, even when skeptics try.
Research by Estrella and Mishkin demonstrated that an inverted yield curve accurately predicted recessions with a six to twenty-four month lead time. Still, the signal is not perfect. Yield curve inversions have had a strong but not perfect forecasting history. The previous inversion happened in October 2022, and there was still no recession two and a half years later. That long gap rattled confidence in the indicator, yet investors can’t seem to look away whenever it flips.
2. Black Monday and the October Effect
2. Black Monday and the October Effect (Image Credits: Stocksnap)
October has a reputation that most other months simply don’t carry. Black Monday, October 19th, 1987, saw the largest stock market drop in history. The Dow dropped 22.6% that day, known as the Crash of 1987, and also as the “October Effect,” joining a list of other stock market superstitions. That single day permanently altered how many investors feel about autumn trading.
The October Effect was cemented into the psychology of investment in 1987. That year, the Dow had its largest drop in history on Monday, October 19th. The very next Monday, there was a similar drop in the market, but the reasons for this repeat performance were quite different. In the second case, economic conditions weren’t driving investor behavior. It was entirely based on superstition. Investors were spooked by the previous week’s events, and behaved as though another crash was inevitable. The bias against October Mondays went on for years, creating a self-fulfilling cycle.
3. The VIX Spike
3. The VIX Spike (Image Credits: Pexels)
The CBOE Volatility Index, widely known as the VIX, is often called Wall Street’s fear gauge, and for good reason. Since its inception, the VIX represents a quick and important measure of market sentiment, giving an immediate snapshot of market expectations of near-term volatility conveyed by S&P 500 stock index option prices. When it spikes suddenly, traders freeze.
The chart history of the VIX is littered with alarming moments. The vertigo-inducing swings can be seen in the VIX, which measures anticipated price moves in stocks. On April 8, 2025, it soared above 50 for the first time since the pandemic and just the second time since the financial crisis, as the Trump administration’s sweeping tariff plans gripped the market in fear. Stock investors showed extreme fear, with the VIX index spiking to top-decile levels. Every time the VIX approaches those extreme levels, seasoned investors feel the same cold recognition, even if context changes each time.
4. The Death Cross
4. The Death Cross (Image Credits: Unsplash)
Technical analysts have given many patterns dramatic names, but the Death Cross stands out. This omen has the virtue of being based on data, embodied in various market indexes and sector funds. The Death Cross forms when the 50-day moving average crosses the 200-day moving average in a downward trajectory. It sounds mechanical, but the psychological reaction it triggers is anything but calm.
Popular and ominously named indicators like the Death Cross or Hindenburg Omen are good examples of signals that often produce false positive readings. Much media hype often seems to fizzle out. One theory holds that the hype itself changes investor behavior, thereby canceling the potential effect. Even knowing that, fund managers and retail investors alike tend to watch the moving averages with quiet anxiety whenever markets weaken.
5. The Hindenburg Omen
5. The Hindenburg Omen (Image Credits: Pexels)
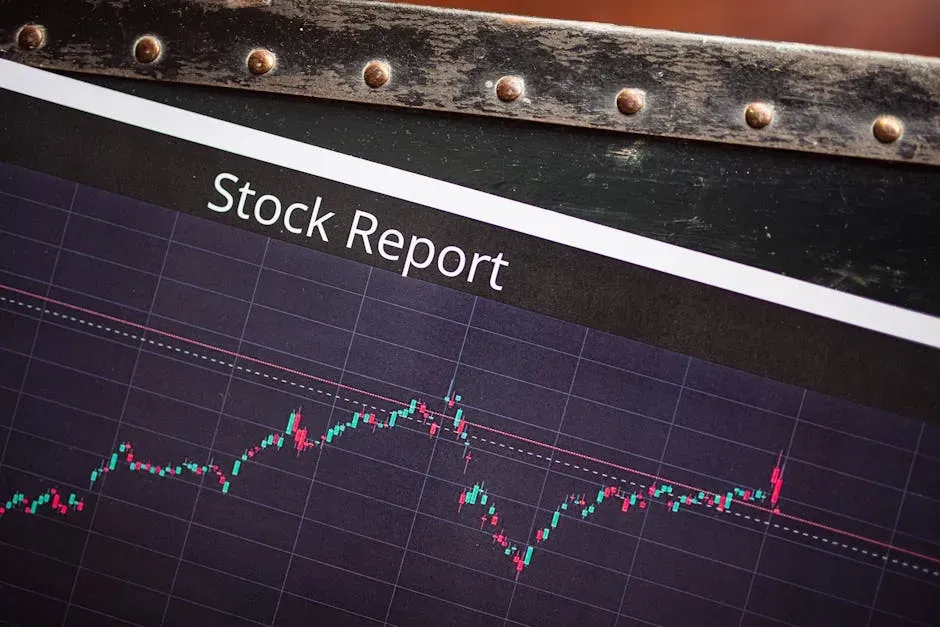
Named after the infamous airship disaster, the Hindenburg Omen is one of the more elaborate fear-triggers in technical analysis. This omen comes into play when five linked technical indicators make a joint appearance. Devised by mathematician Jim Miekka in 1995, it portends a stock market crash. In the last quarter century, every strong downturn has been preceded by the omen, although the time between the omen and a crash has varied from one day to four months.
The name itself carries weight. Miekka’s colleague provided that haunting label, and it stuck precisely because it evokes catastrophe. The superstition effect in market indicators is more pronounced during volatile periods, down markets, and for more opaque firms. Superstition acts as a substitute for information when investors face greater uncertainty. When the Hindenburg Omen appears and markets are already nervous, the effect on sentiment can be self-amplifying, which is perhaps the most unsettling thing about it.
6. The Skyscraper Curse
6. The Skyscraper Curse (Image Credits: Pixabay)
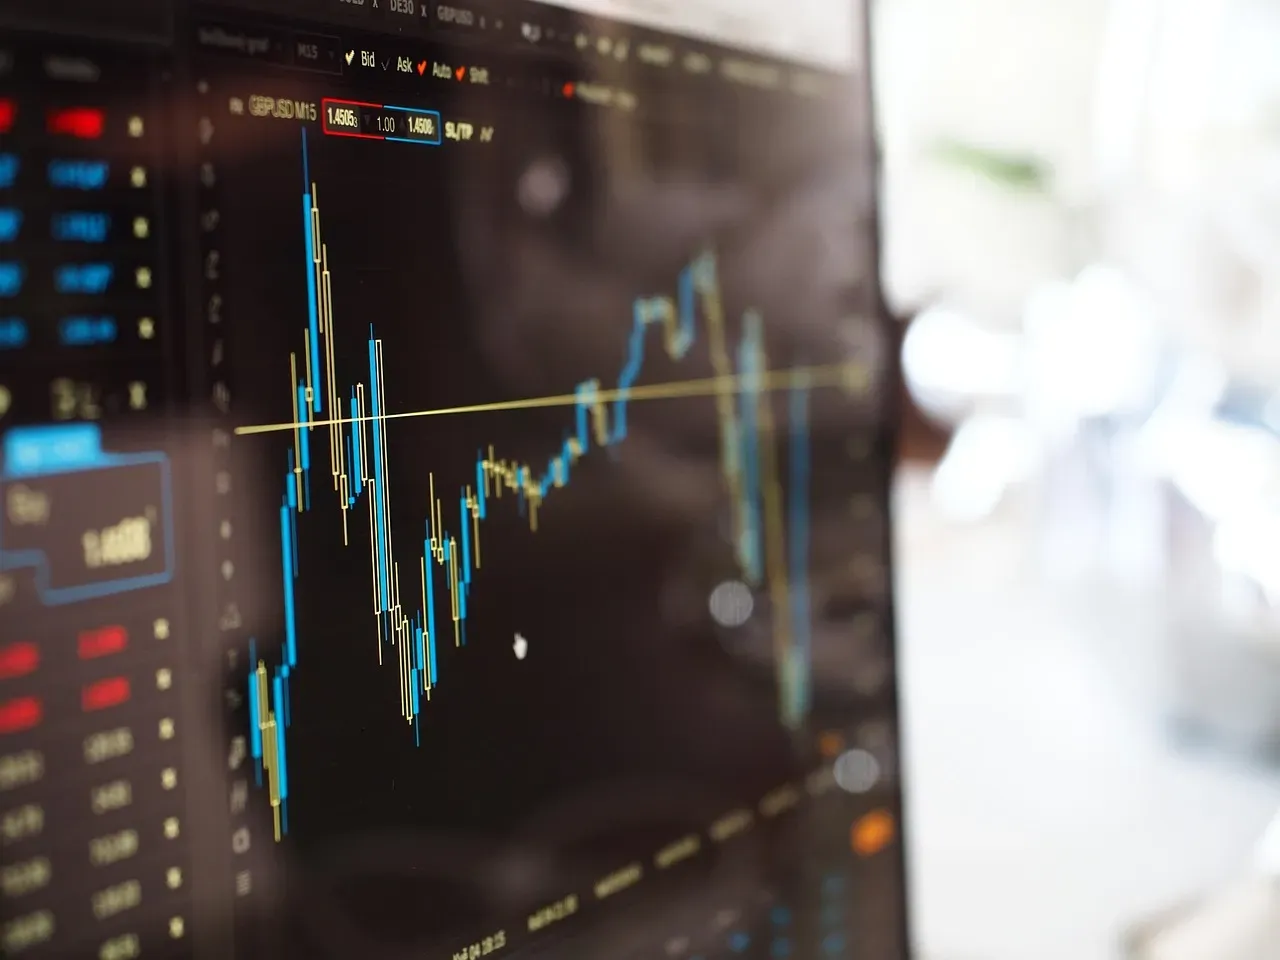
The idea that record-breaking buildings coincide with economic collapse sounds like cocktail party trivia. Yet the historical alignment is striking enough to have a formal name. The Skyscraper Indicator holds that record-breaking skyscrapers coincide with market peaks, noting that the Empire State Building opened in 1931 during the Great Depression, and the Burj Khalifa opened in 2010 shortly after the 2008 crash.
This idea goes back to 1931. It holds that when a country builds the world’s tallest building, its stock market will soon tank. The first case cited is the building of the Empire State Building. After that, new buildings in Chicago in 1974 and Kuala Lumpur in the 1990s led to a drop in stock prices. The underlying logic, when anyone bothers to find one, is that record construction signals excess capital and overheated optimism. Still, timing the market based on cranes in a skyline remains firmly in the realm of coincidence.
7. The Super Bowl Indicator
7. The Super Bowl Indicator (Image Credits: Unsplash)
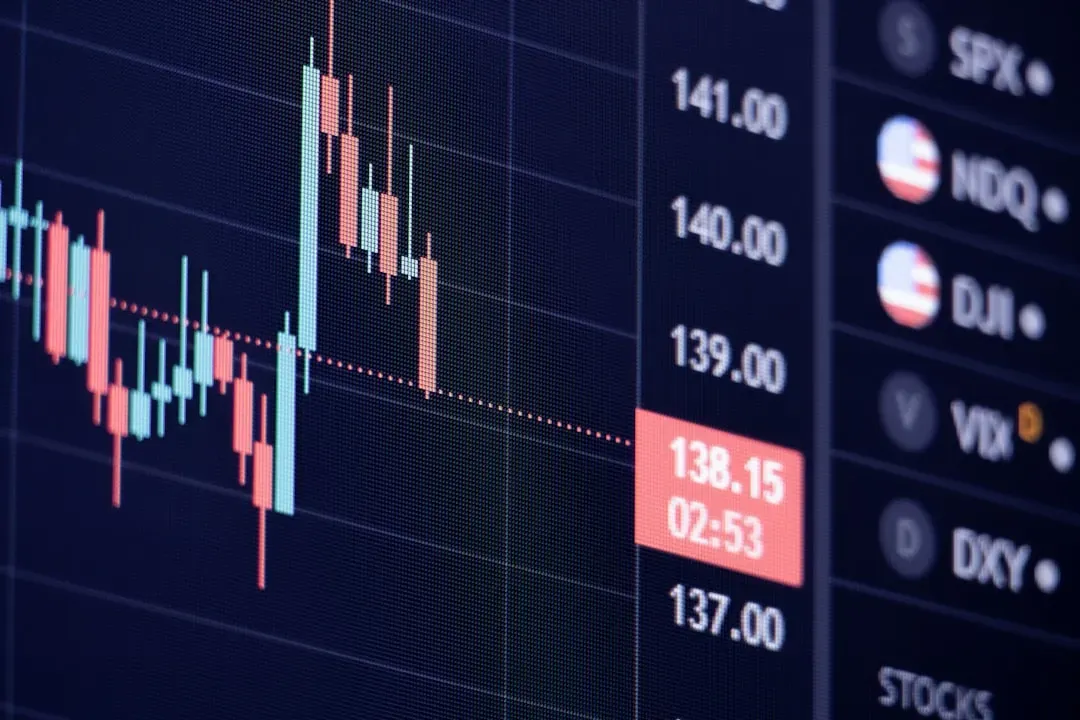
Wall Street has seen some strange ideas, but few are as endearingly absurd as using a football game to predict annual market performance. This quirky metric was first observed by Leonard Koppett, a sportswriter, in 1978 as a joke. He was satirizing analysts who found patterns in random data, poking fun at the human tendency to see meaning where none exists. The uncomfortable part is what happened next.
As of January 2022, the predictor had been right 41 out of 55 games, a 75 percent success rate. The Super Bowl Indicator is delightful Wall Street folklore. Its early success was statistical noise, not market insight, and recent failures confirm what was always suspected: football doesn’t move markets. Yet even people who understand that fully still look up the result every February, just in case.
8. The January Barometer
8. The January Barometer (Image Credits: Unsplash)
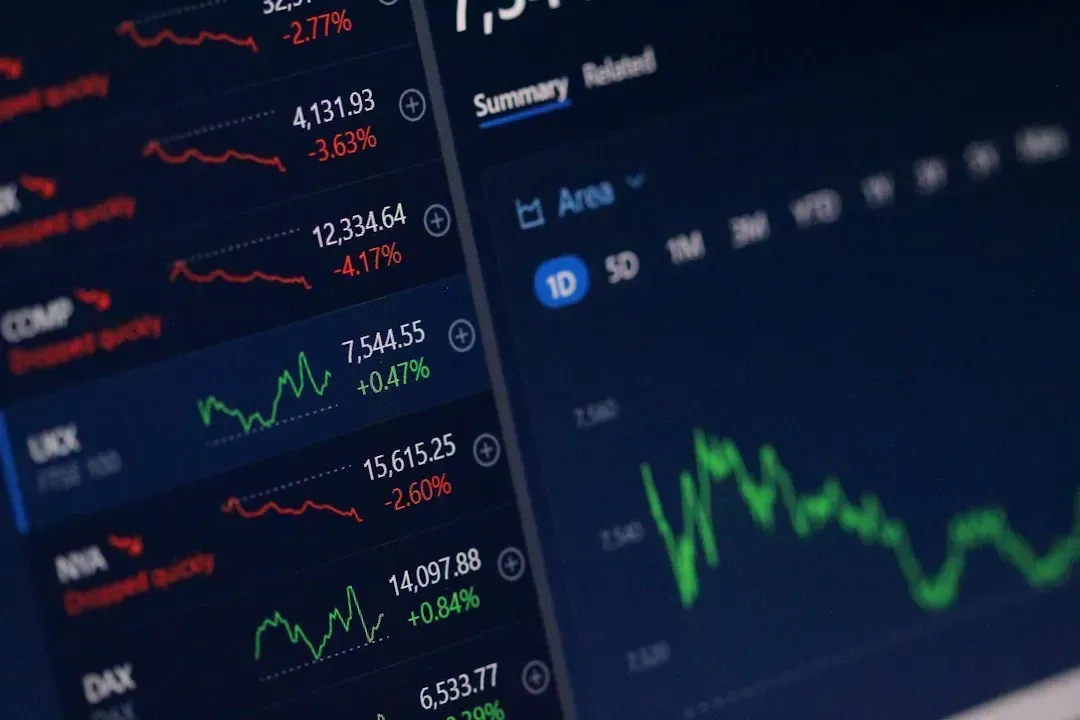
The January Barometer rests on a deceptively simple premise: as January goes, so goes the year. The barometer, according to the Stock Trader’s Almanac, says that as the S&P 500 goes in January, so goes the year. This has been accurate roughly 75 percent of the time since 1950. That kind of historical hit rate is enough to make even skeptical investors pay attention during the first few weeks of the new year.
The historical correlation is aided by the fact that the market has historically trended upward overall. Stocks have produced positive calendar year returns about 71 percent of the time since 1945, including 14 out of 29 times when they declined in January. In other words, the barometer benefits partly from a baseline tailwind. The “January effect,” along with other calendar anomalies like the “Halloween effect,” serves as a compelling case study for behavioral finance. It challenges the cornerstone of traditional financial theory, the Efficient Market Hypothesis, which posits that asset prices fully reflect all available information.
9. The Magnificent Seven Concentration Fear
9. The Magnificent Seven Concentration Fear (Image Credits: Pixabay)
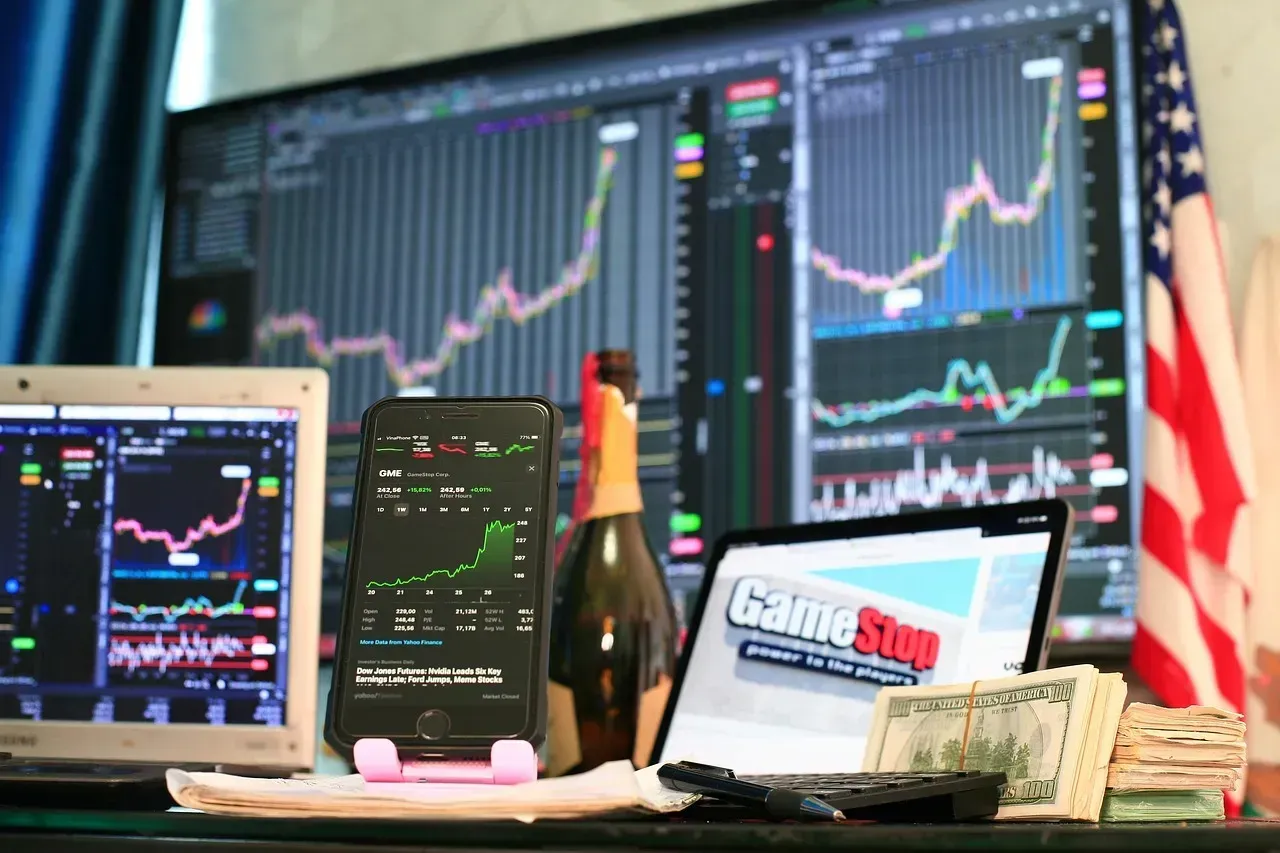
History has a way of rhyming with itself. When a small group of companies drives the vast majority of index gains, experienced investors recognize the pattern from earlier eras and feel a familiar unease. While the “Magnificent Seven” helped lift indices earlier in 2025, concerns mounted about stretched valuations. The tech sector came to represent roughly a third of the S&P 500’s market cap, trading at a forward price-to-earnings multiple significantly above the index overall.
At the very beginning of 2025, legendary investor Howard Marks warned that he was “on bubble watch.” More strategists issued similar warnings as S&P 500 valuations climbed to their highest level since the pandemic. Ned Davis Research strategists noted that semiconductor stocks met the definition for an equities bubble established by professors at Harvard Business School in a 2017 research paper. The concentration fear is not a superstition. It has precedent in the dot-com era, and that precedent is exactly what makes it so unsettling when the numbers start to look familiar again.
What connects all nine of these coincidences is not predictive certainty, but psychology. Investors of all types, including the savvier ones and even corporations, let superstition guide their decisions at times. They tend to put a pattern around one-off events because they want to find structure and predictability, even if the underlying data does not support that desire. Markets are built on collective human judgment, and collective human judgment has never been immune to fear.
The persistence of a statistically significant, albeit small, negative return on a day associated with superstition suggests that psychological biases can indeed create temporary market inefficiencies. Recognizing that dynamic doesn’t make it disappear. Sometimes the most rational thing an investor can do is simply understand why a certain chart, date, or coincidence is raising their pulse, and then decide whether the data actually warrants it.