Most people quietly wonder where they stand financially, but rarely have a reliable frame of reference. Comparing yourself to a neighbor or a coworker gives you almost nothing useful. What actually matters is how your net worth stacks up against people in your same stage of life, because wealth, far more than income, is tied to time.
The most comprehensive source for this kind of comparison is the Federal Reserve’s Survey of Consumer Finances, conducted every three years and released in late 2023 covering 2022 data. Every three years, the Federal Reserve conducts the Survey of Consumer Finances, interviewing thousands of American households about their assets and debts. The 2022 survey, released in October 2023, is the most recent data available. It’s worth understanding what these numbers really say before deciding whether you’re ahead, behind, or right on track.
Why the "Average" Net Worth Is Misleading
Why the "Average" Net Worth Is Misleading (Sustainable Economies Law Center, Flickr, <a href="https://creativecommons.org/licenses/by-sa/2.0/" target="_blank" rel="noopener">CC BY-SA 2.0</a>)
The average net worth in the U.S. is $1.06 million, while the median is $192,700, according to the Federal Reserve. That gap is not a rounding error. It reflects something structural about how wealth is distributed in America.
That figure is far lower than the arithmetic mean of $1.06 million, as extremely high net worth households dramatically skew the averages. Sticking with median net worth is more appropriate for determining whether you’re above or below average. In practical terms, the median tells you what the person in the exact middle of the distribution actually looks like, not a number propped up by billionaires.
The Under-35 Group: Starting From a Complicated Place

The Under-35 Group: Starting From a Complicated Place (Image Credits: Unsplash)
The median net worth for households under 35 is $39,000. Most households in this bracket are still paying off student loans and just starting to build equity. That figure sounds modest, but context matters enormously here.
Younger households gained the most in recent years: the under-35 median net worth jumped from $13,900 in 2019 to $39,000 in 2022, partly driven by rising home values and stock market gains during that period, according to the Federal Reserve’s Survey of Consumer Finances. Still, negative net worth is common for young adults. The 10th percentile for under-25 is negative $10,000, largely driven by student loans, and for 25-34 it’s negative $15,000. If you’re young and in the red, you’re not behind – you’re normal.
Ages 35 to 44: The Compounding Begins

Ages 35 to 44: The Compounding Begins (Image Credits: Pexels)
The median net worth jumps to $135,600 for the 35-44 age group. This is when home equity and retirement account balances start compounding. Many households in this range are also managing mortgages, childcare costs, and career pivots simultaneously, which can slow the climb.
The average, or mean, net worth for 35-44 year olds is approximately $549,600, but the median is $135,600. The average is heavily skewed by high-net-worth households. The median is a better reflection of where most 40-year-olds actually stand. One interesting detail: the 40-44 age bracket actually shows a curious dip in median net worth ($134,382) compared to the 35-39 group ($138,588), suggesting some households take on fresh debt, such as a larger mortgage or business investment, right in the early forties.
Ages 45 to 54: The Peak Earning Window

Ages 45 to 54: The Peak Earning Window (Image Credits: Pexels)
The median net worth reaches $247,200 for those aged 45 to 54. These are peak earning years, and compounding is doing real work on earlier investments. For many households, retirement accounts that were opened in the late twenties or early thirties have now had two decades to grow.
The 25th-to-75th percentile gap widens dramatically with age. At 25-34, the gap between the 25th percentile ($5,000) and 75th percentile ($120,000) is $115,000. By 55-64, it’s $865,000. The decisions you make in your 30s and 40s compound into a significant divide by your 50s. This is precisely why the forties feel like a financial inflection point for so many people.
Ages 55 to 64: The Final Stretch Before Retirement

Ages 55 to 64: The Final Stretch Before Retirement (Image Credits: Pexels)
The median net worth hits $364,500 for the 55-64 age group. This is the final stretch before retirement, where catch-up contributions and reduced spending can accelerate wealth accumulation. Households in this range often experience two forces working in their favor at once: fewer dependents and higher incomes.
The jump from the 35-44 median ($135,600) to the 55-64 median ($409,900) illustrates a roughly threefold increase in just 20 years, showing how powerful compound growth can be when started early. The 401(k) contribution limit for workers under age 50 has increased to $24,500, and the catch-up contribution limit for workers age 50 and older is $8,000, for a total 2025 contribution limit of $32,000. Those who take full advantage of these limits in their late fifties can close surprisingly large gaps.
Ages 65 to 74: The Wealth Peak

Ages 65 to 74: The Wealth Peak (Image Credits: Pexels)
The median net worth peaks at $409,900 for the 65-74 age group. Social Security kicks in, mortgages are often paid off, and net worth plateaus. This is counterintuitive for many people who assume earnings-age and wealth-age track together, but they don’t.
Net worth peaks at 65-74, not at peak earning years of 45-54. This is decades of compounding at work – investments keep growing even as income plateaus. Net worth usually grows as a person ages as savings, investments, and assets accumulate over time. It often dips when people retire, likely due to living on Social Security and fixed incomes while inflation increases costs, including more medical expenses and transitions to assisted living.
Age 75 and Beyond: The Drawdown Phase

Age 75 and Beyond: The Drawdown Phase (Image Credits: Pexels)
The median net worth declines to $335,600 for those aged 75 and older. Spending down savings, healthcare costs, and estate distributions reduce the balance. This is not a sign of failure; it is the natural shape of a retirement plan working as intended.
Net worth typically peaks between 65 and 74, then declines as retirees spend down savings. The drop from $409,900 to $335,600 after age 75 reflects this drawdown phase, not necessarily financial trouble. Retirees should consider more than just account balances. Withdrawal strategy, tax efficiency, and healthcare costs are critical to sustaining income. Even if net worth falls below the median, coordinating withdrawals with Social Security timing can extend portfolio longevity.
The Homeownership Factor: A Wealth Multiplier Unlike Any Other

The Homeownership Factor: A Wealth Multiplier Unlike Any Other (Image Credits: Unsplash)
The wealth gap between homeowners and renters in the U.S. has never been wider. The typical homeowner now has a net worth that’s 43 times greater than that of the average renter, according to an analysis of federal data by the National Association of Realtors. That figure is not an exaggeration – it reflects the sustained surge in home values over the past several years.
The median homeowner in America has a net worth of $400,000 as of 2022, the most recent data available, while the median renter’s net worth is just $10,400. That means the typical homeowner has almost 40 times as much wealth as the typical renter. Home equity makes up the majority of net worth for middle-wealth households. Excluding it drops the overall median from $192,900 to roughly $57,900.
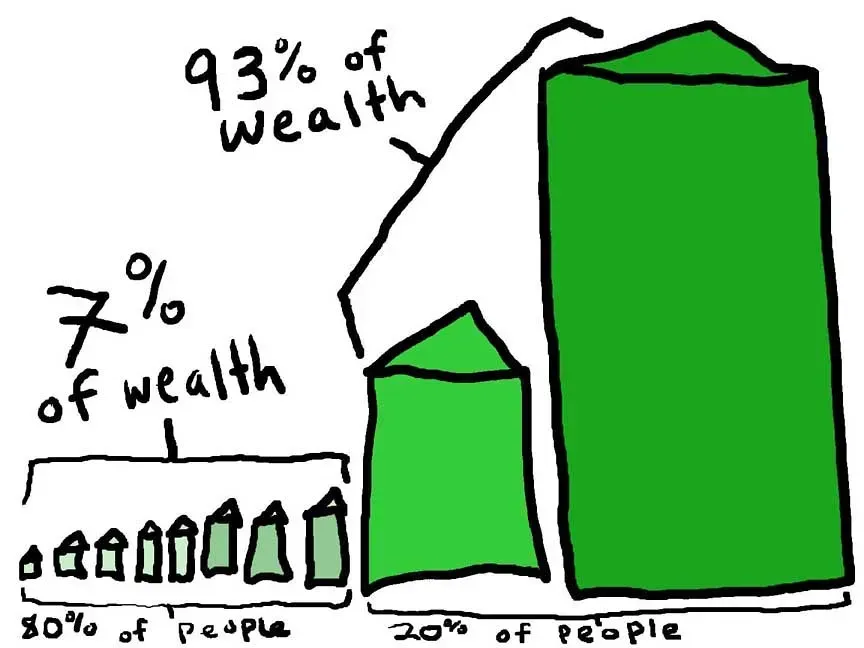
Wealth Concentration at the Top: What the Numbers Reveal

Wealth Concentration at the Top: What the Numbers Reveal (Image Credits: Pexels)
For the fourth quarter of 2024, the top 10% of households by wealth had $8.1 million on average. As a group, they held 67.2% of total household wealth. The bottom 50% of households by wealth had $60,000 on average. These are the structural realities that make “average” a nearly useless benchmark for most people.
Using 2022 SCF microdata, the Richmond Fed reports the following breakpoints: the top 10% of U.S. households have a net worth of $1.56 million or more, while the top 1% requires $11.64 million or more (in 2022 dollars). To put that in perspective, approximately 18% of American households had a net worth of $1 million or more as of the 2022-2023 SCF. A $1 million net worth places you at roughly the 88th to 89th percentile, not the top 1%, which requires $13.6 million or more.
How Much Did Wealth Actually Grow? A 40-Year Record

How Much Did Wealth Actually Grow? A 40-Year Record (Image Credits: Pexels)
From 2016 to 2022, the median U.S. household net worth rose by 61%, increasing from $120,000 to $193,000. That growth reflects gains in home values, stock markets, and increased savings during the pandemic years. The timing was unusual, and it may not repeat anytime soon.
The 2019-to-2022 period saw the largest median net worth increase in 40 years of Fed surveys. Younger households gained the most: the under-35 median net worth jumped from $13,900 in 2019 to $39,000 in 2022, partly driven by rising home values and stock market gains. The next full SCF update is expected in late 2026 and is anticipated to show further gains, though ongoing market volatility and persistent housing costs may temper some of those results.
What the Benchmarks Actually Tell You

What the Benchmarks Actually Tell You (Image Credits: Pexels)
Net worth is often the clearest indicator of your financial position. Unlike income, which shows what you earn, net worth reflects what you’ve built, accounting for debt, savings, investments, and assets like your home or business. Someone earning $250,000 per year but living paycheck to paycheck may have a lower net worth than someone earning far less but saving and investing consistently.
Households that consistently save between 15% and 20% of income while keeping debt low often move above the median net worth for their age group within one or two decades, even with market swings. The households that moved from the 40th to the 75th percentile between ages 35 and 55 did so primarily through consistent retirement contributions, mortgage paydown, and avoided lifestyle inflation – not luck or inheritance. The benchmarks are a useful compass. The trajectory, however, matters far more than any single snapshot.