Every week, millions of Americans head to the grocery store expecting to pick up the usual: bread, milk, a few vegetables, maybe some chicken. Nothing fancy. Yet depending on where you live, that same cart of groceries can cost dramatically more than what your cousin pays two states over. It’s not your imagination, and it’s not just general inflation doing its thing.
According to inflation data published in February 2026 by the U.S. Labor Department’s Bureau of Labor Statistics, food prices in America rose by roughly three percent over the twelve months ending January 2026. That national figure sounds manageable, almost reasonable. That national average, though, hides a much more complex story – because depending on where you live, your grocery bill might be dramatically higher or lower than what families in other parts of the country are experiencing. So if you’ve ever wondered which cities are truly feeling the squeeze at checkout, let’s get into it.
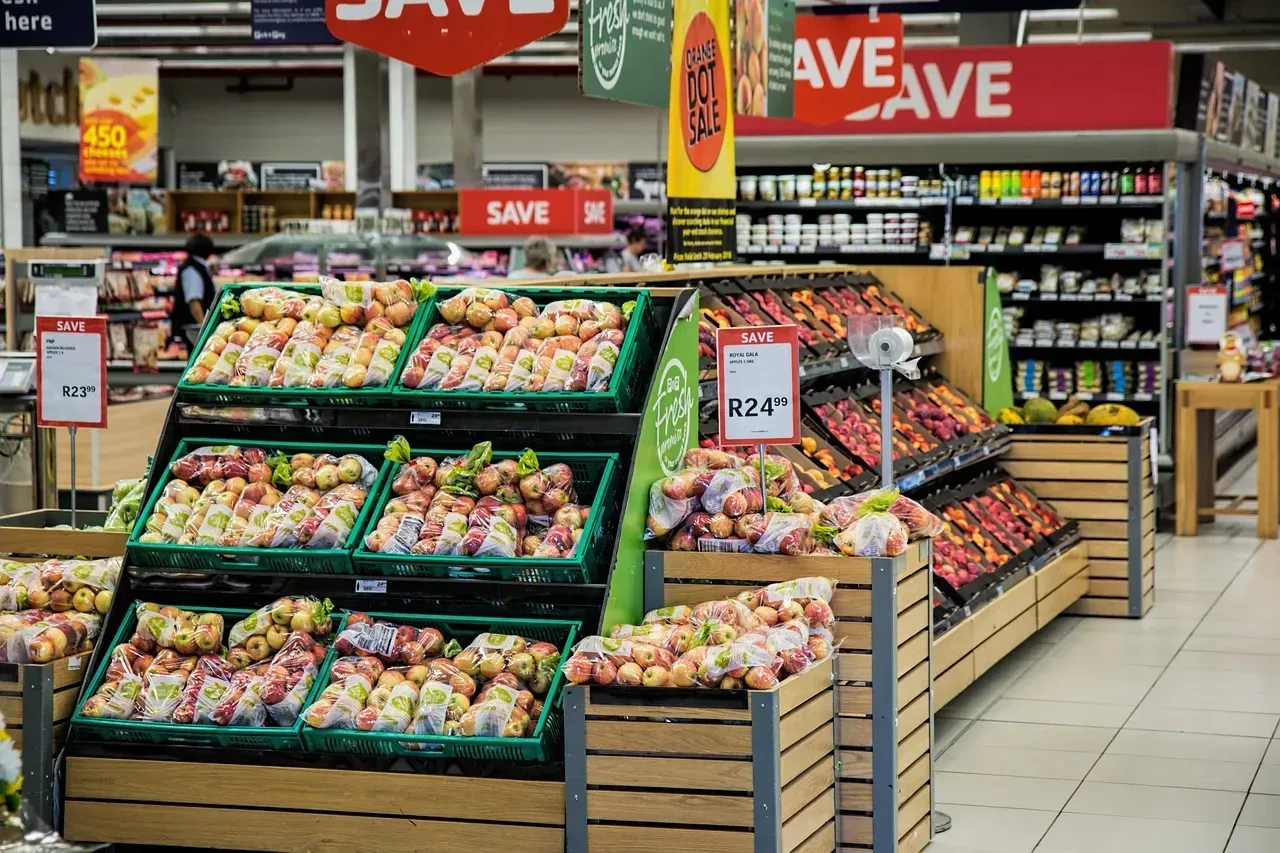
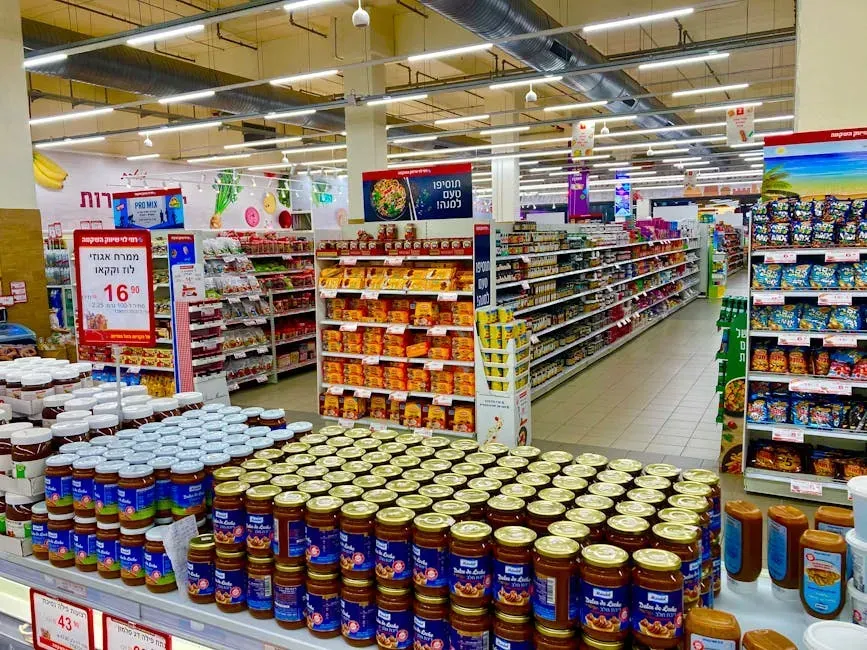
1. Honolulu, Hawaii – The Nation's Priciest Grocery Cart

1. Honolulu, Hawaii – The Nation's Priciest Grocery Cart (Image Credits: Pexels)
With an average monthly grocery spend of around $1,630 and a median household income of $102,382, Honolulu residents pay about 31 percent more than the national average for groceries, making it the most expensive city in the country to stock the fridge. That’s a staggering premium, and it isn’t going away anytime soon.
Since Hawaii is an island state, it has higher import and transportation costs, making everyday items including groceries especially expensive. Picture nearly everything you eat traveling thousands of miles across the Pacific Ocean before it reaches your local supermarket. In late 2025, state regulators approved a roughly 25 percent rate increase for Young Brothers, the sole inter-island barge service that moves food between the islands, with new rates taking effect January 2026 – meaning prices were already rising further even as this data was being collected.
2. Juneau, Alaska – Remote, Isolated, and Expensive
2. Juneau, Alaska – Remote, Isolated, and Expensive (Image Credits: Pixabay)
Groceries in Juneau cost about 28 percent more than the national average, with an average monthly grocery spend of around $1,597. The city’s remote location means most food has to be shipped in, driving up prices. Think of it like ordering everything online with mandatory overnight shipping every single week – except you have no choice.
Juneau residents have adapted their shopping habits out of necessity. Many rely heavily on freezers to stock up when sales hit, treating grocery shopping more like strategic planning than a casual weekly errand. The isolation creates a unique challenge that simply doesn’t exist in most American cities. Honestly, that level of planning just to eat a normal diet is something most of us never think about.
3. Anchorage, Alaska – Alaska's Largest City Still Pays Big
3. Anchorage, Alaska – Alaska's Largest City Still Pays Big (Image Credits: Pexels)
With prices roughly 24 percent higher than the national average, Anchorage residents spend around $18,444 per year on groceries on average, representing nearly one fifth of the median household income. That’s a substantial chunk of income going straight to keeping the pantry stocked. While Anchorage at least has road connections to other parts of Alaska, the state’s overall remoteness still drives costs up significantly.
If you’re a fan of fresh seafood, Alaska offers some of the best prices in the nation for salmon, halibut, and crab. Still, that doesn’t offset the inflated costs of nearly everything else in your shopping cart. It’s a classic trade-off: cheap halibut, expensive everything else.
4. Fairbanks, Alaska – Extreme Cold, Extreme Prices
4. Fairbanks, Alaska – Extreme Cold, Extreme Prices (Image Credits: Pexels)
Fairbanks residents face some of the least affordable groceries in the U.S. Lower incomes combined with high food prices push grocery spending above 21 percent of household income, with an average monthly spend of around $1,529. Three Alaskan cities making this top ten list tells you just about everything you need to know about how geography shapes what you pay for food.
Fairbanks faces an additional challenge beyond just isolation: extreme weather. Harsh winters make transportation even more unpredictable and expensive. When roads freeze over and supply trucks get delayed, grocery shelves thin out – and prices spike accordingly. It’s a reality that shoppers in most of the lower 48 states never have to worry about.
5. Manhattan, New York – High Prices, But High Paychecks Too

5. Manhattan, New York – High Prices, But High Paychecks Too (Image Credits: Pexels)
Manhattan’s grocery prices are about 16 percent higher than the national average, with an average monthly grocery spend of around $1,439. While incomes are also relatively high, food still takes a sizable share of household budgets. New York City has always had a reputation for being expensive, and the supermarket is no exception to that rule.
It probably comes as no surprise that Manhattan has higher food prices than the rest of the country. A higher-than-average median household income helps offset that somewhat. A typical household earns around $101,000 per year and spends roughly $17,268 of that on groceries – that’s 17 percent of income going toward food, still above the 15 percent recommendation. So yes, the salaries are better, but the grocery bill reminds you you’re still in New York.
6. San Francisco, California – The Surprising Exception on This List
6. San Francisco, California – The Surprising Exception on This List (Image Credits: Pexels)
With an average monthly grocery spend of around $1,432 and a median household income of $125,456, San Francisco’s strong income actually helps offset grocery costs. It’s the only city on the list where households stay within the recommended grocery spending range. That is genuinely surprising given how expensive everything else in the city is.
San Francisco wouldn’t be most people’s first thought when it comes to “affordable.” It’s one of the most expensive cities in which to live. But when you compare the average grocery spend with the median income, the typical household spends just 13.7 percent of its earnings to keep the fridge stocked – making it the only city on this list where a household earning the median income can follow the recommendation to spend 15 percent or less of their budget on food. It’s a rare win for a city that loses on almost every other cost metric.
7. Brooklyn, New York – High Bills, Lower Wages
7. Brooklyn, New York – High Bills, Lower Wages (Image Credits: Pexels)
Brooklyn households spend a smaller dollar amount on groceries than Manhattan residents, but lower incomes mean food consumes more than 22 percent of earnings, with an average monthly grocery spend of around $1,424. Cross the East River and the financial picture changes fast. Same expensive city, much tighter paychecks.
While Brooklyn residents technically spend a little less per month on groceries than their Manhattan neighbors, the dramatically lower median household income means groceries are far less affordable here, despite the slightly lower price tag. With a typical household spending 22.2 percent of its income on food, it’s the second-least-affordable city in the United States when it comes to keeping your family fed. That gap between Manhattan and Brooklyn wages is doing a lot of heavy lifting here.
8. Queens, New York – One Borough Over, Still Feeling It
8. Queens, New York – One Borough Over, Still Feeling It (Image Credits: Unsplash)
Groceries in Queens cost about 13.7 percent more than the national average, with an average monthly grocery spend of around $1,408. For many households, food spending takes up over one fifth of annual income. Three New York boroughs landing in the national top ten is a testament to just how pervasive the city’s cost pressure really is.
With a median household income of $81,399, groceries take up roughly 20.7 percent of a household’s budget in Queens. Their wallets might not be quite as strained as their Brooklyn neighbors’, but they’re definitely feeling the pinch more than the typical Manhattan household. The difference between boroughs is surprisingly stark, and it mostly comes down to who earns what.
9. San Diego, California – Sunny Skies, Pricey Aisles
9. San Diego, California – Sunny Skies, Pricey Aisles (Image Credits: Pexels)
Grocery prices in San Diego are 12.3 percent above the national average. Fortunately, residents also enjoy one of the higher median household incomes among the cities on this list. When factoring in their income, a San Diego household spends just 16.2 percent of their budget on food. It’s not cheap, but it’s not catastrophic either. Think of it as the middle ground of expensive.
An NBC and Telemundo coast-to-coast analysis of grocery prices found that while shoppers in San Diego and across the country often pay the same price whether they buy in-store or order online for pickup, regional price differences can add up. The analysis compared prices at Walmart, Target, and Whole Foods in 14 areas nationwide, finding the lowest prices in the Midwest and the highest on the West Coast, including San Diego. Even discount chains can’t fully insulate San Diego shoppers from the regional price premium.
10. Oakland, California – The Most Unaffordable on the Entire List
10. Oakland, California – The Most Unaffordable on the Entire List (Image Credits: Unsplash)
Oakland has the least affordable groceries among the cities on this list, with an average monthly grocery spend of around $1,388 and a median household income of $73,200. Here’s the thing that catches most people off guard: Oakland’s raw grocery prices are actually lower than San Francisco’s. The problem is the income gap between the two cities is enormous.
When you factor in Oakland’s significantly lower median household income of $73,200, the cost to keep a household fed takes up 22.8 percent of that income. In terms of relative affordability, Oakland residents rank lowest among the cities on this list – meaning groceries are the least affordable here. It’s a sharp reminder that affordability isn’t just about price tags. It’s about how much of your paycheck disappears before you even get home from the store.
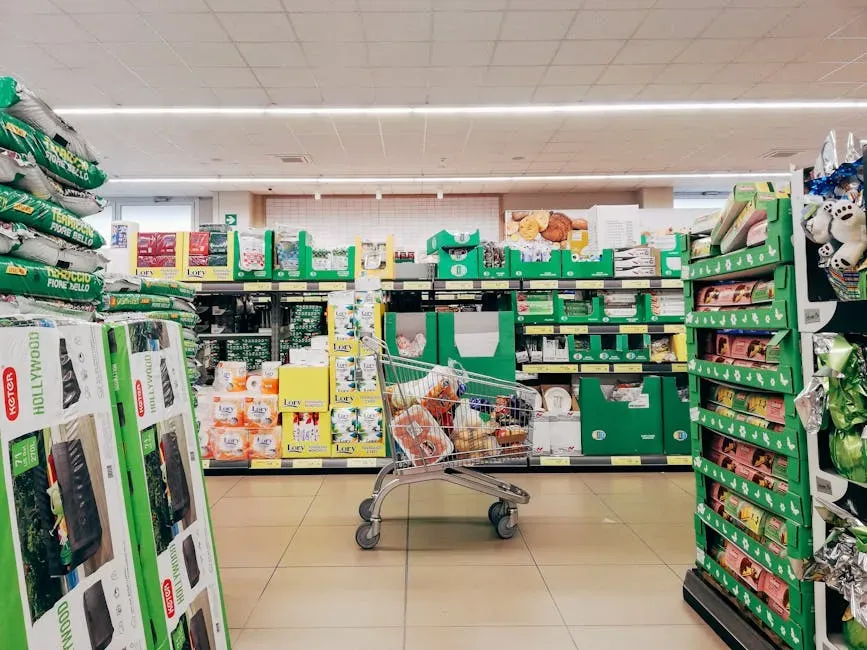
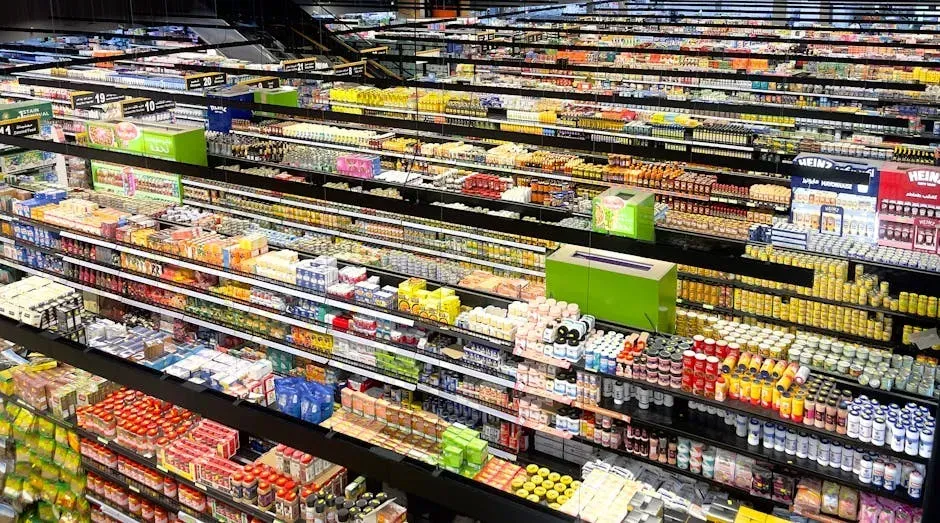
Why Are Grocery Prices So Much Higher in These Cities?
Why Are Grocery Prices So Much Higher in These Cities? (Image Credits: Pixabay)
The explanation for high grocery prices can often be buried in a region’s average grocery store operating costs or how different chains get a product to their stores. Reasons include the differences between supply chain and overhead expenses, including local labor, utilities, taxes, and real estate costs. It’s rarely just one factor. It’s everything piling on top of everything else at once.
When it comes to grocery prices across the United States, there’s a significant variance influenced by factors such as geography, local economies, and transportation costs. Hawaii grapples with the highest grocery prices in the nation, with the isolation of the islands contributing to steep prices as goods often need to be imported. In 2026, overall food prices are predicted to rise roughly 3.6 percent, with grocery store prices rising around 3.1 percent – faster than the 20-year historical average rate of increase. For residents in these ten cities already paying a steep premium, that trajectory means things are unlikely to get easier any time soon.
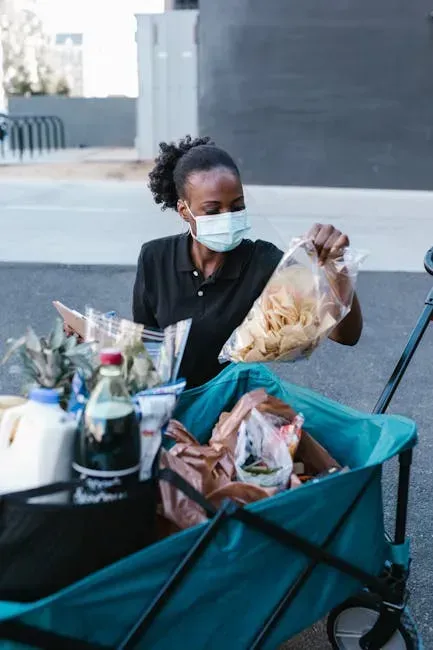
What These Numbers Mean for Real Households

What These Numbers Mean for Real Households (Image Credits: Unsplash)
Financial experts typically recommend spending no more than 10 to 15 percent of take-home pay on groceries. Almost none of the cities on this list met that benchmark. Using pretax income data, nine of the ten cities had average monthly grocery costs that exceeded 15 percent of household income – meaning the share of take-home pay going toward food is even higher. That’s not a small gap. That’s a structural squeeze affecting millions of families.
The USDA’s monthly cost of food reports outline what a balanced, nutritious diet should cost nationwide. Based on the latest USDA food plan report, a four-person household should spend from roughly $992 to $1,628 per month depending on how thrifty they want to be. In all of these cities, the average monthly grocery bill sits closer to the USDA’s most generous estimate than to the thrifty one. In other words, even careful shoppers in these cities are essentially running on the USDA’s premium plan whether they like it or not. What would you do differently if your city was on this list?