
Sixty-one is an interesting place to be financially. For most Americans, it’s close to peak wealth territory, the product of four decades of working, saving, paying off debt, and watching home values climb. It’s also a moment of real reckoning: retirement is no longer abstract, Social Security decisions are approaching, and how much you’ve accumulated suddenly matters in a very concrete way.
Numbers can be both reassuring and humbling, depending on where you land. The data available right now draws from the Federal Reserve’s 2022 Survey of Consumer Finances, still the most comprehensive look at household wealth in the United States. Here’s what those numbers say about Americans near your age, and what they actually mean for your financial picture.
The Benchmark Numbers for Ages 60 to 64

The Benchmark Numbers for Ages 60 to 64 (Image Credits: Pexels)
The median net worth for Americans ages 60 to 64 is $392,860, rising only slightly to $393,480 for those ages 65 to 69. That near-flat line between the two age groups is telling in its own right. It suggests that for many households, the early retirement years involve drawing down assets roughly in line with investment growth, keeping the balance roughly steady.
Americans aged 55 to 64 have the second-highest average net worth among all age groups, at $1,566,900. The average, though, is pulled upward considerably by a small number of very wealthy households. The gap between mean and median is large because averages get pulled upward by the wealthiest households, making the median the more useful benchmark for understanding where most people actually stand.
Why the Average and the Median Tell Very Different Stories

Why the Average and the Median Tell Very Different Stories (Image Credits: Pexels)
The most recent Federal Reserve Survey of Consumer Finances shows a dramatic split: the average net worth of all U.S. families is $1,063,700, while the median, the figure that splits the population in half, is just $192,700. That gap is enormous, and it matters enormously when you're trying to gauge where you stand. The wealthiest one percent hold approximately 31 percent of all U.S. wealth.
The median is a more accurate representation, because a few very rich households drive up the average. So if you're comparing yourself to a headline figure like "average net worth," be careful. Median figures are far lower than averages, highlighting how a few high-wealth households skew results. In the 50s, for instance, the average net worth is $1,364,050, but the median is only $180,227, meaning half of households in that age range have less than that amount.
Net Worth Tends to Peak Right Around This Age

Net Worth Tends to Peak Right Around This Age (Image Credits: Unsplash)
Net worth tends to peak in the 60s, largely due to the compounding of savings over a lifetime and the fact that people are just entering retirement and starting to withdraw from their investment accounts. It's a natural high-water mark, and understanding that can shift how you think about it. Net worth often peaks around retirement age, then declines as people begin withdrawing savings, spending down assets, and experiencing reduced income, with required minimum distributions, healthcare costs, and lifestyle spending all contributing.
As of January 2026, average net worth in the 60s reaches $1,577,907, then begins to decline gradually in the 70s to $1,456,151 and beyond. The decline isn't a failure. It's exactly what accumulated savings are designed to do. When reaching retirement age, the average person's net worth generally starts to decrease due to withdrawing from retirement savings, and the 50s and 60s are typically when people start to max out their retirement savings to prepare for the retirement phase.
How Home Equity Shapes the Picture at 61

How Home Equity Shapes the Picture at 61 (Image Credits: Unsplash)
A high net worth concentrated in illiquid assets, such as a paid-off home, may not translate directly into retirement income. For many Americans approaching 62, a significant share of their net worth lives in their home, not their brokerage account. Home equity is more than half the net worth at the 25th percentile, and for median net worth households, home equity is again half or more of net worth for most age groups above age 30.
Much of the increase in net worth over recent years has been driven by home prices increasing in the United States, with the median price of houses sold going from $313,000 in early 2019 to $433,100 by early 2022, an increase of 38 percent. That run-up has significantly lifted paper wealth for homeowners. The median price of an existing home was $400,500 in January 2026, slightly down from the high prices of 2022.
Retirement Savings: 401(k)s and IRAs at This Stage

Retirement Savings: 401(k)s and IRAs at This Stage (Image Credits: Pexels)
The average 401(k) balance across all age groups is $144,400, according to Fidelity Investments' Q3 2025 data. For people in their early 60s, however, the balances are generally higher, reflecting decades of contributions and compounding. Retirement assets accounted for roughly a third of all household financial assets in the United States at the end of December 2025, according to the Investment Company Institute, with total U.S. retirement assets reaching $49.1 trillion.
Given the shrinking window before retirement, one of the most important net worth-building steps in your 50s and 60s may be to max out retirement accounts, and it's also critical to consider paying down outstanding debt during this time. The IRS allows workers aged 60 to 63 to make especially large catch-up contributions. The 401(k) contribution limit for workers under 50 has increased to $24,500, while the catch-up contribution limit for workers age 50 and older is $8,000, for a total 2025 contribution limit of $32,000.
What Wealth Inequality Looks Like at This Age
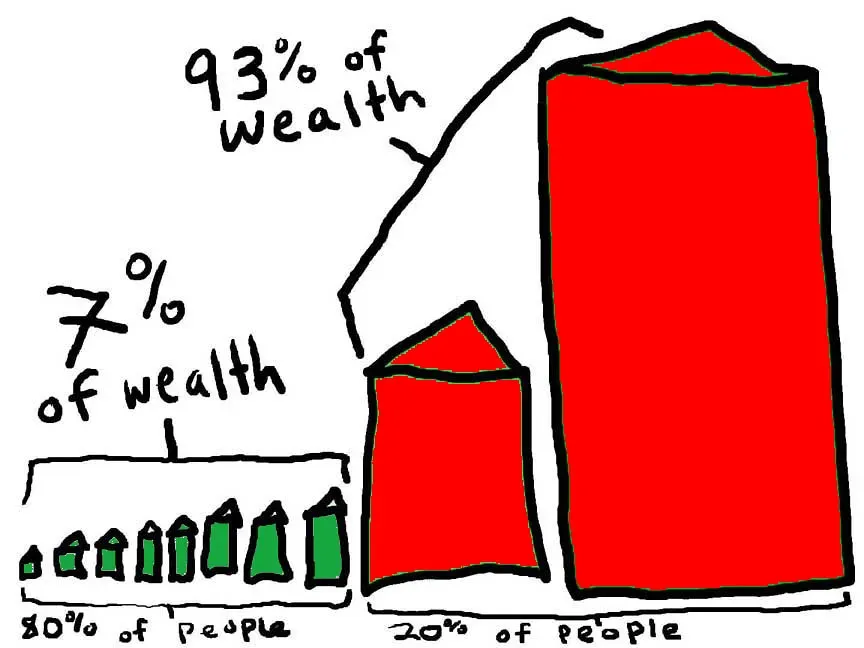
What Wealth Inequality Looks Like at This Age (Sustainable Economies Law Center, Flickr, <a href="https://creativecommons.org/licenses/by-sa/2.0/" target="_blank" rel="noopener">CC BY-SA 2.0</a>)
At the 90th percentile, net worth is pretty flat, around $2.5 million to $3 million, from the early 50s to the 80s. At the top, the numbers climb sharply. The 95th percentile peaks slightly under $7 million in the late 60s, while the 99th percentile rises sharply with age until peaking over $22 million in the late 60s.
The 75th percentile is higher than the 50th by much more than the 50th exceeds the 25th, reflecting the increasing inequality in society where wealth is concentrated near the top. In practical terms, that means hitting the median is a genuinely meaningful achievement, not a consolation prize. Growth in net worth hasn't been equal across all households; the biggest percentage increases have been seen among those with the lowest starting net worth, often by paying down debt or accumulating assets for the first time.
The Role of Education and Household Structure

The Role of Education and Household Structure (Image Credits: Pexels)
At every additional stage of education, both average and median net worth increase for American households. While higher education can be costly in the short term, the difference between college graduates and those who did not finish high school is stark: the median net worth for those with a college degree is over eleven times higher. That gap tends to compound over a working lifetime and shows up clearly in the numbers by the time people reach their 60s.
The family structure statistics for net worth show a positive effect for couples, likely due to their ability to share expenses, savings, and investments, and even couples who must provide for dependents have a higher average net worth than single people with no children. Couples with no children have the highest average net worth among family structures, at $1,867,480.
Retirement Readiness: The Gap Between Net Worth and Income

Retirement Readiness: The Gap Between Net Worth and Income (Image Credits: Pexels)
The National Retirement Risk Index from the Boston College Center for Retirement Research reveals that nearly half of U.S. households are at risk of not having enough retirement income to maintain their pre-retirement lifestyle, reflecting ongoing concerns about inadequate savings, longer lifespans, and rising healthcare costs. Net worth alone doesn't resolve that risk. Net worth and retirement readiness are related but not identical, and a high net worth concentrated in illiquid assets may not translate to actual retirement income.
Combined with average Social Security retirement benefits of roughly $24,000 annually for a single person, based on 2025 to 2026 SSA data, that's a workable foundation for many households, particularly those with paid-off homes and moderate expenses, though for households with higher spending or significant healthcare needs, it's a starting point that requires a more detailed plan. The actual average retirement age in the United States is 61, five years earlier than most Americans expect.
Total U.S. Household Wealth Is Still Rising – With Caveats

Total U.S. Household Wealth Is Still Rising – With Caveats (Image Credits: Unsplash)
More recent real-time estimates indicate that household wealth has continued to rise since the 2022 survey, with data from the Fed's Financial Accounts of the United States showing that total household net worth exceeded $170 trillion by 2025, reflecting continued gains in equity markets and housing values. That's a broad tailwind, but it doesn't lift all boats equally. Net worth isn't a static number; it fluctuates as asset prices rise and fall, and recent shocks have fueled volatility.
From 2019 to 2022, public equities and home equity grew as a share of the average household balance sheet, not necessarily because of increased contributions, but because of rising asset values during the bull market and housing boom, and that shift may now be reversing as interest rates rose and markets cooled. Anyone at 61 watching their account balances month to month knows this feeling well. Staying the course is generally seen as the best way to avoid locking in losses, benefit from recovery, and not harm your net worth.
What These Numbers Actually Mean for You

What These Numbers Actually Mean for You (Image Credits: Pexels)
Whether a given net worth figure is "good" depends entirely on your expenses and income in retirement. A household spending $50,000 a year with full Social Security benefits needs far less in savings than one spending $80,000 with limited Social Security income, and net worth is one input into the retirement equation, not the whole answer. Context matters enormously here. These figures don't account for cost of living, career path, or what you actually need to fund your retirement, and a lower net worth with modest expenses and reliable Social Security income can support a more secure retirement than a higher net worth with high spending and no plan.
Net worth gets used everywhere as a personal scoreboard, a retirement readiness test, or a way to compare yourself to others, but it was never designed to measure future financial security. It tells you what's in your portfolio, not what's coming to support you over the next 20 to 30 years. At 61, the most productive use of these benchmarks isn't to grade yourself but to identify gaps while there's still time to close them.