
Most people have a rough number in their head for retirement. Some imagine a million dollars will do the trick. Others hope Social Security will cover the gap. The problem is that the actual math tends to be a good deal harsher than the estimate.
The distance between what Americans have saved and what they’ll realistically need in retirement is wide, and in many cases, it’s growing. Understanding exactly where that gap sits, and why it exists, is the first step toward doing something about it.
What Americans Actually Have Saved Right Now

What Americans Actually Have Saved Right Now (Image Credits: Unsplash)
The average retirement savings for all American families is $333,940, while the median sits at just $87,000. That gap between the two figures isn't a fluke. The mean retirement savings is significantly higher than the median, largely because high earners have more than a million dollars more saved than lower earners, pulling up the overall average.
Over half of American households, roughly 54%, report having no dedicated retirement savings at all, according to the Federal Reserve's Survey of Consumer Finances. That's a striking statistic in a country with such a sophisticated financial system. The fact that only about 64% of non-retirees have any retirement account at all, whether a 401(k), IRA, or defined benefit pension, leaves roughly a third of the working population with nothing set aside.
The "Magic Number" People Think They Need

The "Magic Number" People Think They Need (Sustainable Economies Law Center, Flickr, <a href="https://creativecommons.org/licenses/by-sa/2.0/" target="_blank" rel="noopener">CC BY-SA 2.0</a>)
The figure Americans believe they need to retire comfortably in 2026 is $1.46 million, which is $200,000 more than the $1.26 million figure from 2025 and still far beyond what most people have saved. That upward creep in the target number reflects real anxiety about inflation, healthcare, and longevity. Bankrate's 2025 Retirement Savings Report found that about one third of workers think they'll need more than a million dollars, while a separate Betterment survey found nearly half of U.S. workers said they'd need at least that much.
Nearly two in five Americans, about 39%, said "not having enough saved for retirement" was a top financial concern in an April 2025 NerdWallet survey. The fear is well-founded. Only about 5% of households with retirement accounts have one million dollars or more actually saved. So while a million-dollar target has become the cultural benchmark, almost nobody reaches it.
How Savings Stack Up at Every Age

How Savings Stack Up at Every Age (Image Credits: Pexels)
Americans in their 20s have an average retirement savings balance of around $139,616, with the median at $42,502. For younger workers, time is the primary asset, and compounding does a lot of heavy lifting over decades. By the time people reach their 30s, the average rises to roughly $275,377, while the median sits at $92,533.
Americans in their 40s have an average balance of $573,660, with the median at $208,390. The spread between those two numbers is significant, reflecting just how unequal accumulation becomes as people move through peak earning years. By the 50s, the average reaches about $1,020,838 and the median is $438,866, a stage when retirement is close enough that saving should be a top priority, and catch-up contributions of an additional $8,000 to a 401(k) become available.
The Benchmarks Financial Planners Actually Use

The Benchmarks Financial Planners Actually Use (aag_photos, Flickr, <a href="https://creativecommons.org/licenses/by-sa/2.0/" target="_blank" rel="noopener">CC BY-SA 2.0</a>)
Fidelity's widely cited rule of thumb suggests having at least one times your salary saved by 30, three times by 40, six times by 50, eight times by 60, and ten times by age 67. These milestones sound clean on paper, but they're genuinely difficult for the majority of workers to hit. Fidelity suggests saving 15% of pre-tax income annually, including any employer match, which is the rate they recommend to maintain your lifestyle in retirement.
Another common framework is the 25x rule, where you multiply your anticipated first-year retirement spending by 25. If you plan to spend $60,000 in your first year, you'd aim to save $1.5 million. This method is based on the 4% rule, which suggests withdrawing 4% of your retirement portfolio in year one. In 2025, many experts suggest the 4% rule is a useful starting point, but not a one-size-fits-all solution.
The Healthcare Cost That Almost Nobody Plans For

The Healthcare Cost That Almost Nobody Plans For (Image Credits: Pexels)
According to Fidelity's 2025 Retiree Health Care Cost Estimate, the average couple will need $330,000 after taxes to cover medical expenses over the course of their retirement, excluding long-term care. That's a line item most retirement plans barely account for. According to a paper from the LIMRA Retirement Income Institute, healthcare costs, long-term care needs, and caregiving responsibilities consistently rank as consumers' top threats to long-term financial security, above market declines or recessions.
For an average healthy 65-year-old couple, total annual healthcare costs will rise from around $17,003 in the first year of retirement to $55,513 at age 85. National average lifetime premiums for traditional Medicare options alone are projected at nearly $689,000, rising to over $955,000 when deductibles, copays, hearing, vision, and dental costs are included. Research by Jackson Financial found that nearly two-thirds of pre-retired investors are underestimating their expected healthcare expenses, and only 27% believe they will require long-term care, even though 70% of individuals turning 65 are likely to need it.
What Social Security Actually Covers

What Social Security Actually Covers (Senator Mark Warner, Flickr, <a href="https://creativecommons.org/licenses/by/2.0/" target="_blank" rel="noopener">CC BY 2.0</a>)
In 2024, Social Security remained the most common source of retirement income, with 78% of retirees receiving it. Among those aged 65 and older, that share rises to 91%. The program is foundational, but it was never designed to be a complete retirement income on its own. For those who start benefits at full retirement age in 2026, Social Security replaces as much as 79% of income for very low earners, about 43% for medium earners, and roughly 28% for maximum earners.
Social Security benefits for 75 million Americans increased 2.8% in 2026, translating to roughly $56 more per month on average. The timing of claiming matters enormously. Waiting past full retirement age can meaningfully increase your Social Security benefit. Claiming at 62 may result in only 70% of your full benefit, while waiting until 70 could deliver 124%.
The Healthcare Inflation Problem Nobody Talks About Enough

The Healthcare Inflation Problem Nobody Talks About Enough (Image Credits: Unsplash)
Healthcare cost inflation is expected to remain high, with a projected long-term rate of 5.8% for a couple retiring in 2026, while Social Security COLAs are projected to rise by only around 2.4% annually. That's a persistent and compounding mismatch. In 2026, Medicare Part B premiums jumped nearly 10%, from $185 in 2025 to $202.90, while the Social Security COLA rose only 2.8%.
Under current projections, a healthy 55-year-old couple with average Social Security benefits will need all of their benefits, and then some, to cover medical premiums and out-of-pocket expenses by the time they retire. A 65-year-old couple today will need roughly 84% of their benefits for healthcare alone. Women face an added disadvantage: they receive around 75% of the Social Security retirement benefits of men, live at least two years longer on average, and face projected healthcare costs that are roughly 27% higher over a lifetime.
The Retirement Readiness Gap by Generation

The Retirement Readiness Gap by Generation (Image Credits: Pexels)
In 2024, only 35% of Americans felt on track for retirement, up slightly from 34% in 2023 but notably down from 40% in 2021. Confidence is not evenly distributed across generations. Gen X has the lowest confidence among working generations. The Transamerica 2025 survey shows 64% are confident about retiring comfortably, but only 18% are very confident. BlackRock's survey puts even fewer Gen Xers on track.
Middle-class households plan to spend a median of 26 years in retirement, based on a planned lifespan of 89. Yet the median actual retirement age among middle-class retirees is 62, often earlier than planned and frequently driven by health issues or job loss rather than choice. That gap between planned and actual retirement age matters because it means people are both drawing down savings sooner and spending more years relying on them. With more than 11,000 Americans turning 65 every single day through 2027, the pressure to plan has rarely been more concentrated.
How to Catch Up If You're Behind

How to Catch Up If You're Behind (Image Credits: Pexels)
Workers under 50 can contribute up to $23,500 annually to a 401(k) in 2025, while those 50 and up are allowed an additional catch-up contribution. For 2026, the base limit rises to $24,500, and those aged 60 to 63 may contribute an additional $11,250 in so-called "super catch-up" contributions. These higher limits aren't a cure-all, but they do offer a real lever for those in their final working years. Under a new provision that took effect in January 2026 as part of SECURE 2.0, individuals aged 50 and older who earned more than $150,000 in 2025 are required to put catch-up contributions into a Roth 401(k), meaning taxes are paid upfront but withdrawals in retirement are tax-free.
In 2024, 82% of all retirees reported they were doing okay or living comfortably financially, with an even higher share among those who continued earning wages or had supplemental private income. That suggests the mix of income sources matters just as much as the size of the nest egg. Many experts recommend saving enough to have access to 70% to 80% of your current income in retirement, which means Social Security alone, for most people, leaves a meaningful shortfall that personal savings must fill.
The Wealth Inequality Hiding Inside the Averages
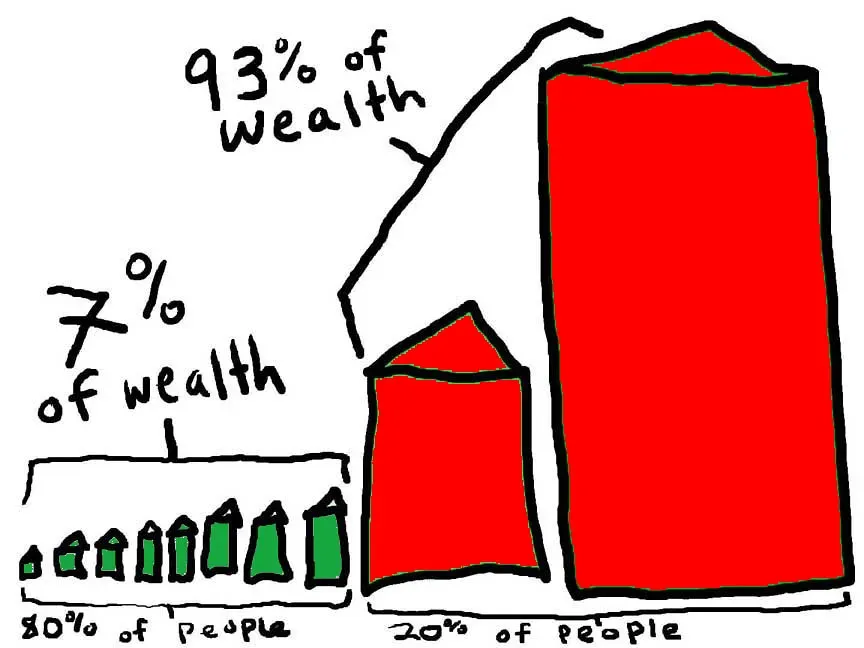
The Wealth Inequality Hiding Inside the Averages (Sustainable Economies Law Center, Flickr, <a href="https://creativecommons.org/licenses/by-sa/2.0/" target="_blank" rel="noopener">CC BY-SA 2.0</a>)
Race plays a decisive factor in retirement savings outcomes. White Americans had a median retirement account value of $100,000 in 2022, which was $61,000 more than Black Americans and $46,600 more than Hispanic Americans. These aren't just statistical differences; they reflect decades of compounding inequality in wages, wealth-building opportunities, and access to employer-sponsored plans. Empower research shows that while the majority of Americans, about 70%, contribute to a retirement plan, only 47% of Gen Z workers save in one, compared to 75% of Millennials and 76% of Gen Xers.
Retirement assets as a whole accounted for 34% of all household financial holdings in the U.S. as of December 2025, with the national nest egg growing to $49.1 trillion, up $3.3 trillion from the third quarter. That headline sounds reassuring. Yet those gains are heavily concentrated at the top, and the median household remains far closer to the $87,000 figure than to any number that would sustain a multi-decade retirement. The numbers are real. The question is simply which ones reflect your situation.